Immunostaining of PFA fixed 3T3 cells expressing a TOM70-mCherry reporter protein with FluoTag®-Q Atto 488 anti-RFP sdAb (Cat. No. N0401-At488-L, dilution 1:500, the mCherry signal is represented in red, the corresponding FluoTag-signal is represented in green and the merge of both channels is represented in yellow). Nuclei were visualized by DAPI staining (blue).

FluoTag-Q anti-RFP AF647

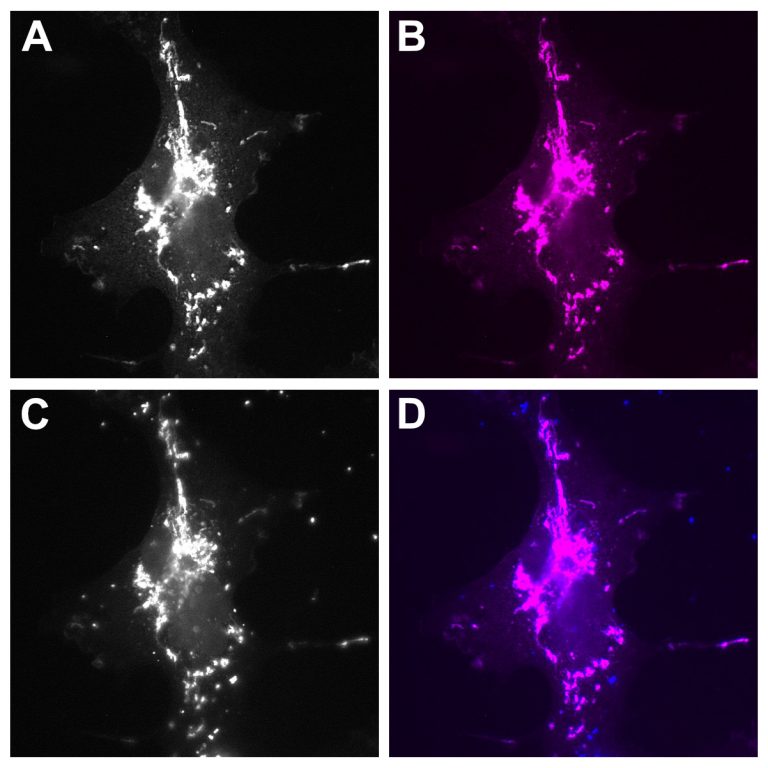
PFA-fixed Cos7 cells expressing a TOM70-nfRFP-BFP fusion protein (nf: non-fluorescent) were stained with FluoTag®-Q anti-RFP coupled to Alexa Fluor 647 (Cat. No. N0401-AF647, dilution 1:500). A Greyscale image of the staining performed with N0401-AF647. B False color representation of the image shown in A is displayed in magenta (coloring according to the excitation wavelength of the employed fluorophore). C The corresponding BFP signal of the depicted section. D Merge of A and C. False color representation of A in magenta and C in blue.

FluoTag-Q anti-RFP AF568

PFA-fixed Cos7 cells expressing a TOM70-nfRFP-BFP fusion protein (nf: non-fluorescent) were stained with FluoTag®-Q anti-RFP coupled to AZDye 568 (Cat. No. N0401-AF568, dilution 1:500). A Greyscale image of the staining performed with N0401-AF568. B False color representation of the image shown in A is displayed in red (coloring according to the excitation wavelength of the employed fluorophore). C The corresponding BFP signal of the depicted section. D Merge of A and C. False color representation of A in red and C in blue.

FluoTag-Q anti-RFP At488

PFA-fixed Cos7 cells expressing a TOM70-nfRFP-BFP fusion protein (nf: non-fluorescent) were stained with FluoTag®-Q anti-RFP coupled to Atto 488 (Cat. No. N0401-At488, dilution 1:500). A Greyscale image of the staining performed with N0401-At488. B False color representation of the image shown in A is displayed in green (coloring according to the excitation wavelength of the employed fluorophore). C The corresponding BFP signal of the depicted section. D Merge of A and C. False color representation of A in green and C in blue.

FluoTag®-Q anti-RFP

Cat No: N0401 Category:

400,00 

FluoTag®-Q anti-RFP is derived from an in-house developed single-domain antibody (sdAb) recognizing the most common red fluorescent proteins like mRFP, mCherry, DsRed and other DsRed derivatives with high affinity and specificity.

Read more

One of the first red-emitting fluorescent proteins (FP) described was DsRed from Discosoma sp. Only shortly after its publication in 1999 and including more than 20 mutations, a monomeric version with several enhanced characteristics was discovered, mRFP1. From this promising monomeric red-FP, dozens of monomeric variants have been described, from which mCherry represents one of the most popular derivatives. Today more than 800 entries of various fluorescent proteins can be found in an open-source database with the most currently available variants in the fluorescence protein database “fpbase”

Our nanobodies bind specifically and strongly to DsRed, RFP, and mCherry, among other family members. Look at our specificity chart in the Resource Section.

FluoTags® can be equipped with a single fluorophore for more quantitative readouts (FluoTag-Q), with two fluorophores per single-domain antibody (FluoTag-X2), and we also developed a blend of two sdAbs bindings simultaneously the target proteins and each bearing two fluorophores (FluoTag-X4). For more detailed information on the FluoTags, please check our Technology Section.


MSDS
Variations:
Conjugation Amount Cat No. RRID
Atto488 200 μl N0401-At488-L AB_3075917
AZDye568 200 μl N0401-AF568-L AB_3075915
Atto643 200 μl N0401-At643-L AB_3075918
Alexa647 200 μl N0401-AF647-L AB_2905529
AbberiorStar635P 200 μl N0401-Ab635P-L AB_2744602
Related Products: -
Clone: 2B12
Host: Alpaca
Produced in: E.coli
Application: IF
Dilution: 1:1000 (corresponding to 5 nM final concentration)
Capacity: N/A
Antigen: -
Targets: mRFP
Specificity: It recognizes RFP (red fluorescent protein) and other RFP-derivatives like mOrange, dsRed1, dsRED2, tdTomato, mCherry and mScarlet-i. Probably also other derivatives not yet tested.
Formulation:

A single sdAb clone was lyophilized from PBS pH 7.4 containing 2% BSA (US-Origin). Reconstitute with 200 µL of 50 % glycerol in deionized water. We recommend including 0.1 % sodium azide as a preservative if applicable. When reconstituted in 200 µl, the concentration of single-domain antibody is 5 µM

kDa: -
Ext Coef: -
Shipping: Ambient temperature
Storing:

Vials containing lyophilized protein can be stored at 4 °C for 6 months. We recommend reconstituting the protein with 50 % glycerol including 0.1 % sodium azid as preservative if applicable. Minimize the number of freeze-thaw cycles by aliquoting the reconstituted protein. Long term storage at -80 °C up to 6 months. Working aliquots can be stored at -20 °C for up to 4 weeks.

Protocols:

Western Blotting is not recommended with this product, sdAbs tend to recognize native protein conformation only.

Look at detailed protocols and our specificity chart in our Resource Section.

References:
  1. Vicidomini R, Choudhury SD, Han TH, et al. Versatile nanobody-based approach to image, track and reconstitute functional Neurexin-1 in vivo. Nat Commun. 2024;15(1):6068. Published 2024 Jul 18. doi:10.1038/s41467-024-50462-2 (IHC; STED, fruit fly)
  2. de Jong-Bolm D, Sadeghi M, Bogaciu CA, et al. Protein nanobarcodes enable single-step multiplexed fluorescence imaging. PLoS Biol. 2023;21(12):e3002427. Published 2023 Dec 11. doi:10.1371/journal.pbio.3002427 (IF; HEK293)
  3. Andres-Alonso M, Borgmeyer M, Mirzapourdelavar H, et al. Golgi satellites are essential for polysialylation of NCAM and expression of LTP at distal synapses. Cell Rep. 2023;42(7):112692. doi:10.1016/j.celrep.2023.112692
  4. Wessel AK, Yoshii Y, Reder A, et al. Escherichia coli SPFH Membrane Microdomain Proteins HflKC Contribute to Aminoglycoside and Oxidative Stress Tolerance. Microbiol Spectr. 2023;11(4):e0176723. doi:10.1128/spectrum.01767-23
  5. Oleksiievets N, Sargsyan Y, Thiele JC, et al. Fluorescence lifetime DNA-PAINT for multiplexed super-resolution imaging of cells. Commun Biol. 2022;5(1):38. Published 2022 Jan 11. doi:10.1038/s42003-021-02976-4 (FL-DNA PAINT)
  6. Borgmeyer MK. Regulation of synaptic signaling following environmental enrichment and local secretory trafficking in neuronal dendrites. PhD thesis (2022). University of Magdeburg.
  7. Borgmeyer M, Coman C, Has C, et al. Multiomics of synaptic junctions reveals altered lipid metabolism and signaling following environmental enrichment. Cell Rep. 2021;37(1):109797. doi:10.1016/j.celrep.2021.109797
  8. Gombkoto P, Gielow M, Varsanyi P, Chavez C, Zaborszky L. Contribution of the basal forebrain to corticocortical network interactions. Brain Struct Funct. 2021;226(6):1803-1821. doi:10.1007/s00429-021-02290-z
  9. Levic DS, Ryan S, Marjoram L, Honeycutt J, Bagwell J, Bagnat M. Distinct roles for luminal acidification in apical protein sorting and trafficking in zebrafish. J Cell Biol. 2020;219(4):e201908225. doi:10.1083/jcb.201908225
  10. Konietzny A, González-Gallego J, Bär J, et al. Myosin V regulates synaptopodin clustering and localization in the dendrites of hippocampal neurons. J Cell Sci. 2019;132(16):jcs230177. Published 2019 Aug 22. doi:10.1242/jcs.230177
  11. Sograte-Idrissi S, Oleksiievets N, Isbaner S, et al. Nanobody Detection of Standard Fluorescent Proteins Enables Multi-Target DNA-PAINT with High Resolution and Minimal Displacement Errors. Cells. 2019;8(1):48. Published 2019 Jan 14. doi:10.3390/cells8010048 (DNA PAINT)
Notice: To be used in vitro/ for research only. Non-toxic, non-hazardous, non-infectious.
Legal terms: By purchasing this product you agree to our general terms and conditions.